


Table of Contents
- Why Soil Resistivity Matters
- How Electricity Moves Through Soil
- Typical Soil Resistivity Ranges
- From Field Resistance to Apparent Resistivity
- Wenner vs. Schlumberger: Practical Comparison
- Designing the Field Test Plan
- Common Measurement Challenges
- Field Safety Is Part of Data Quality
- Seasonal and Environmental Effects
- Turning Measurements Into an Engineering Soil Model
- What a Defensible Soil Resistivity Report Should Include
- Standards and Technical References
- Related Prime Process Safety Center Resources
- When to Bring in a Qualified Specialist
ENGINEERING FIELD GUIDE: Soil Resistivity Information and Field Testing
How accurate earth-resistivity data supports grounding, cathodic protection, corrosion control, and safe electrical infrastructure.
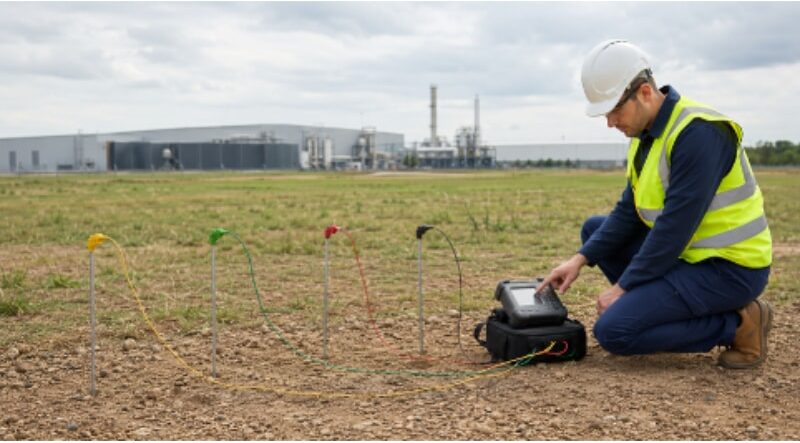
Four-pin soil-resistivity testing at an industrial site. Source: Prime Process Safety Center
The engineering takeaway
Soil type tables are screening tools—not design inputs. Site-specific measurements, adequate probe spacing, perpendicular traverses, interference checks, and a defensible soil model are essential when grounding performance and personnel safety depend on the result.
Why Soil Resistivity Matters
A grounding system is only as effective as the earth into which it must disperse current. Soil resistivity, expressed in ohm-meters (Ω·m), describes how strongly a volume of soil opposes electrical-current flow. It is a foundational input for substation grounding, industrial grounding grids, lightning protection interfaces, transmission and renewable-energy facilities, cathodic protection, buried-pipeline corrosion studies, and investigations of ground potential rise (GPR), touch voltage, and step voltage.
A low-resistivity soil generally allows current to spread more readily. A high-resistivity soil can require a larger grid, deeper or additional electrodes, different conductor geometry, ground enhancement measures, or other engineering controls. Yet a single “soil resistivity” number rarely describes a real site. Soil commonly changes with depth, location, moisture, temperature, soluble salts, density, and geology. The engineering task is therefore to measure enough of the site, at enough spacings and directions, to derive a soil model appropriate for the proposed system.
Grounding and bonding also play an important role in controlling electrostatic charge. See Prime Process Safety Center’s grounding and bonding FAQ and its detailed electrostatic resources for related process-safety applications.
How Electricity Moves Through Soil
Two mechanisms can contribute to conduction in earth materials:
- Ionic or electrolytic conduction—the movement of dissolved ions through moisture in soil pores. This is usually the dominant mechanism in ordinary soil.
- Electronic conduction—the movement of electrons through conductive minerals, metallic inclusions, or other conductive phases.
Because electrolytic conduction usually dominates, moisture content, pore-water chemistry, temperature, porosity, compaction, and grain structure can materially affect measured resistivity. Wet clay with dissolved ions may be relatively conductive; dry sand, gravel, or competent rock may be highly resistive. When soil freezes, mobile water and ion movement can decrease sharply, causing shallow-layer resistivity to rise—sometimes by orders of magnitude.
Typical Soil Resistivity Ranges—Useful, but Not a Substitute for Testing
Illustrative planning ranges only. Actual values can fall outside these ranges depending on moisture, temperature, chemistry, compaction, and stratification.
| General soil description | Illustrative resistivity range (Ω·m) |
|---|---|
| Clay | 15–150 |
| Loam | 15–100 |
| Sandy clay | 50–300 |
| Sand | 200–3,000 |
| Gravel and sand | 500–5,000 |
| Solid rock | 10,000+ |
Table 1. Typical soil resistivity ranges.
Do not design from the table alone
Two soils that look nearly identical in a test pit may have very different electrical behavior. Conversely, one site can contain conductive fill near the surface, dry native soil below it, and competent rock at depth. Field measurements are needed to replace assumptions with defensible data.
From Field Resistance to Apparent Resistivity
Four-pin tests inject a known alternating test current through two current electrodes and measure the resulting voltage between two potential electrodes. The instrument determines resistance as R = V/I. Array geometry is then used to convert measured resistance to apparent resistivity. “Apparent” is important: where the earth is layered or laterally nonuniform, the calculated value represents the combined response of the soil volume sampled by the array—not necessarily the true resistivity of a single homogeneous layer.
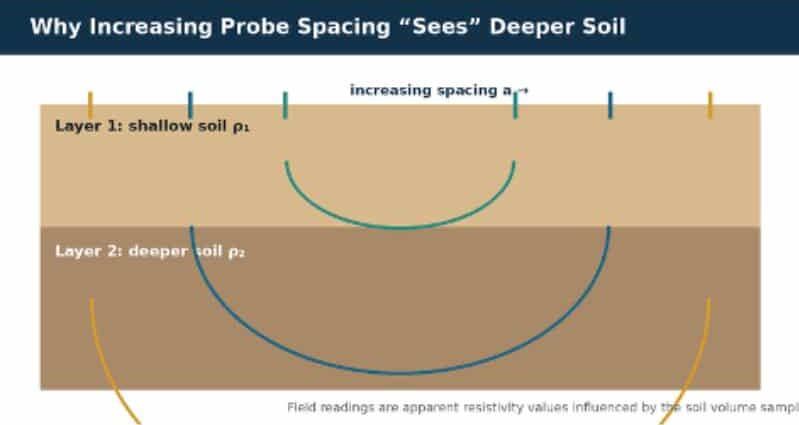
Figure 1. Larger electrode spacing increases the volume and depth of soil influencing the measurement. Diagram by Prime Process Safety Center.
The Wenner Alpha Four-Pin Method
The Wenner alpha array is the most widely used field configuration. Four probes are installed in a straight line at equal spacing a. The outer probes inject current, and the inner probes measure voltage. Measurements are repeated at progressively larger spacings along the same traverse.
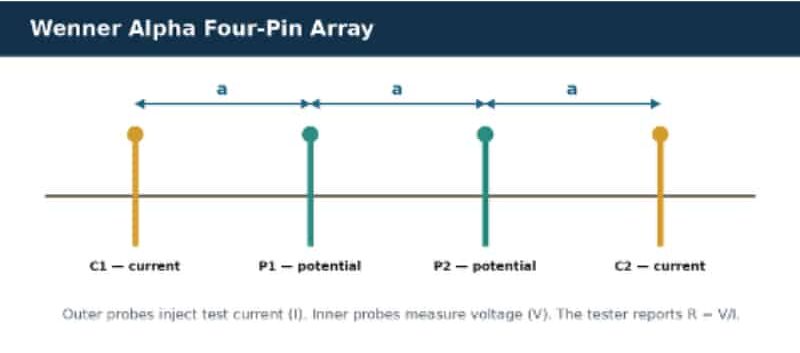
Figure 2. Equal spacing is the defining feature of the Wenner alpha array. Diagram by Prime Process Safety Center.
Simplified Wenner equation
When probe penetration depth b is small relative to spacing a, apparent resistivity is approximately: ρa = 2πaR = 2πa(V/I). Use consistent units: if a is in meters and R is in ohms, ρa is in Ω·m.
For shallow probe insertion, the simplified expression is convenient and commonly used. Where probe depth is not negligible compared with spacing, apply the full geometric correction required by the selected method or governing procedure. Larger spacing does not create a sharply defined “test depth”; it increases and redistributes the soil volume contributing to the measurement. Interpreting spacing as an exact depth is therefore an approximation, not a physical boundary.
The Schlumberger Method
The Schlumberger array uses a smaller central spacing between the potential electrodes and progressively larger spacing to the current electrodes. The potential probes can often remain in place while the current probes move outward. This can reduce field labor, cable length, and the space needed to obtain a response from deeper soil.
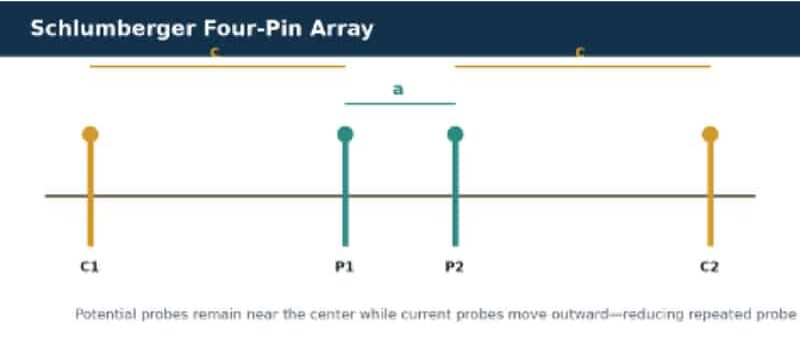
Figure 3. Schlumberger geometry uses different potential- and current-electrode spacings. Diagram by Prime Process Safety Center.
Simplified Schlumberger equation
For a symmetric array where a is the spacing between potential electrodes and c is the distance from each potential electrode to its adjacent current electrode, and probe depth is negligible: ρa = πc(c + a)R/a. Confirm notation before using any formula because references do not always define a and c identically.
The method can be efficient, but measured resistance may become small as the current electrodes move farther away. The field instrument must have adequate output power, noise rejection, and voltage sensitivity. The preferred array is project-specific and should be selected before mobilization, considering site access, expected resistivity, available lead lengths, buried infrastructure, and the analysis software to be used.
Wenner vs. Schlumberger: Practical Comparison
| Consideration | Wenner alpha | Schlumberger |
|---|---|---|
| Probe movement | All four probes typically move for each spacing. | Potential probes remain fixed for multiple current-probe positions. |
| Field speed | Simple geometry; more repeated relocation. | Often faster where long soundings are needed. |
| Signal level | Often produces a comparatively larger measured resistance. | May require greater instrument sensitivity at wide current-electrode spacing. |
| Space and leads | Long traverses and four lead positions. | Can reach comparable investigation depth with compact central potential spacing. |
| Best use | Common grounding and corrosion surveys. | Efficient vertical sounding where access and signal quality permit. |
Table 2. Comparison between Wenner alpha and Schlumberger methods.
Designing the Field Test Plan
A good test program begins before the crew drives the first probe. The plan should connect the proposed grounding or cathodic-protection system to the required measurement extent, spacing sequence, traverse locations, seasonal assumptions, safety controls, and data-quality criteria.
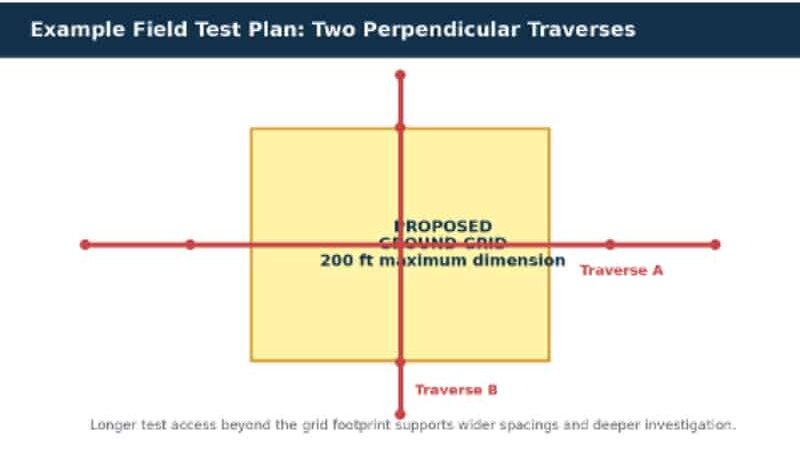
Figure 4. Example layout for a 200-foot grounding system using perpendicular traverses and extended test access. Diagram by Prime Process Safety Center.
- Define the engineering objective. Identify whether the data will support grounding-grid design, GPR and touch/step calculations, lightning interfaces, cathodic protection, corrosion screening, forensic investigation, or another study.
- Review available information. Examine civil plans, geotechnical logs, utility records, site grading, proposed grid geometry, known fill, groundwater conditions, and nearby transmission or pipeline corridors.
- Select array and traverse locations. Use clear, straight paths that avoid known buried conductors where possible. Plan at least two approximately perpendicular directions to help identify lateral variation and interference.
- Choose a spacing sequence. Include small spacings that characterize soil near shallow conductors and larger spacings appropriate to the grounding-system footprint and expected depth of influence. Use a logarithmic or otherwise deliberate progression rather than arbitrary intervals.
- Establish quality checks. Define repeat readings, reciprocal or perpendicular checks, acceptable noise or stability limits, and criteria for relocating probes.
- Document conditions. Record GPS coordinates, probe spacing and depth, array orientation, instrument settings, weather, recent rainfall, surface condition, observed geology, nearby infrastructure, and anomalies.
Common Measurement Challenges—and What the Symptoms Mean
| Challenge | Typical symptom | Practical response |
|---|---|---|
| Poor probe contact | Unstable, very high, or nonrepeatable resistance. | Drive the probe deeper if permitted; add a parallel auxiliary probe; improve local contact with water where the test procedure allows; never salt a location unless the effect and cleanup are acceptable. |
| Buried metal or grounding conductors | Unexpectedly low readings, discontinuities, or strong directional differences. | Review utility information; rotate the traverse; increase separation; compare perpendicular measurements; relocate and document. |
| Lead coupling and geometry | Reading changes when cables move or lie close together. | Separate current and potential leads, avoid loops, cross at right angles where necessary, and follow instrument guidance. |
| External electrical noise | Fluctuating values, overload, or inconsistent readings at selected frequencies. | Use frequency selection/noise rejection, repeat the measurement, and avoid known energized corridors when practicable. |
| Insufficient test current or sensitivity | Noisy or low-resolution values at large spacing/high resistivity. | Use an instrument with adequate power and sensitivity; improve electrode contact; adjust array or timing. |
| Lateral nonuniformity | Perpendicular traverses yield materially different curves. | Do not force a one-dimensional interpretation; add traverses and consider a more suitable soil model. |

Table 3. Troubleshooting soil resistivity measurement challenges.
Field Safety Is Part of Data Quality
Ground testing can place long conductors in environments affected by energized power systems, induction, lightning, traffic, excavation hazards, and buried utilities. The testing plan should address utility locating, safe approach distances, induced voltage, weather and lightning, personal protective equipment, traffic control, communications, and manufacturer instructions. Testing near energized substations or transmission facilities requires project-specific electrical-safety planning by qualified personnel.
Seasonal and Environmental Effects
A field survey captures conditions at a specific time. Shallow soil may change significantly after rain, irrigation, drought, freezing, thawing, chemical releases, deicing-salt application, grading, or placement of imported fill. Deeper layers are often less sensitive to day-to-day weather, but groundwater and long-term seasonal changes can still matter.
- Moisture: increasing water content generally lowers resistivity until pore connectivity and ion concentration effects level off.
- Temperature: resistivity commonly rises as temperature falls; freezing can sharply increase resistivity because ion mobility is restricted.
- Chemistry: dissolved salts can reduce resistivity and increase corrosion risk; chemical enhancement materials require durability, environmental, and maintenance review.
- Compaction and structure: density, void ratio, cracks, layering, and backfill interfaces change current paths.
- Construction changes: excavation, driven piles, buried piping, foundations, and imported fill can make post-construction conditions different from the original survey.
Conservative seasonal design
If the facility must remain safe year-round, evaluate the soil condition that produces the limiting grounding performance—not merely the condition present on the test day. Seasonal correction or sensitivity analysis should be technically justified and documented.
Turning Measurements Into an Engineering Soil Model
Plotting apparent resistivity against electrode spacing is the starting point, not the end. A flat curve may be consistent with approximately uniform soil. An increasing curve can indicate a more resistive deeper layer; a decreasing curve can indicate a more conductive deeper layer. Curves can also be distorted by lateral changes, buried conductors, limited site dimensions, or measurement error.
Engineering software can fit uniform, two-layer, or multilayer soil models to measured data. Model selection should reflect data quality and the sensitivity of the grounding design—not simply which model produces the smallest mathematical error. An overcomplicated model may imply a level of certainty the field data does not support. The report should retain the raw readings, identify excluded points, explain assumptions, compare modeled and measured apparent resistivity, and state the model’s limitations.
What a Defensible Soil Resistivity Report Should Include
- Project objective, site description, date, personnel, and applicable procedures or standards.
- Instrument make/model, serial number, calibration status, test frequency or automatic frequency selection, and lead configuration.
- Array method, exact notation, probe depth, spacing sequence, traverse orientation, and coordinates.
- Weather, recent precipitation, temperature, surface condition, and observed soil/geology.
- Nearby buried or overhead infrastructure and steps taken to avoid interference.
- Raw resistance or voltage/current data, calculated apparent resistivity, repeat readings, and field notes.
- Plots of apparent resistivity versus spacing for every traverse.
- Selected uniform, two-layer, or multilayer model with fit comparison and engineering rationale.
- Data limitations, seasonal assumptions, and recommendations for the grounding or cathodic-protection analysis.
Standards and Technical References
The applicable standard depends on the project objective and jurisdiction. Key references include:
- IEEE Std 81-2025 — guidance on measuring earth resistivity, ground impedance, surface potentials, touch and step voltages, instrumentation, safety, and measurement distortion.
- IEEE Std 80-2013 — guidance for safe AC substation grounding and evaluation of grounding-system performance.
- ASTM G57-20 — Wenner four-electrode soil-resistivity measurement, commonly associated with corrosion assessment and control of buried structures.
- Frank Wenner’s original Bureau of Standards paper — the historical foundation of the four-electrode method.
Standards should be checked for the edition adopted by the project, owner, authority, or contract. Access to the complete standard may require purchase or subscription.
Related Prime Process Safety Center Resources
- A Complete Guide to Electrostatic Testing — Overview of resistivity, conductivity, charge behavior, and ESD-related testing.
- Electrostatic Hazard Assessment — Facility-focused evaluation of charge generation, accumulation, discharge, grounding, and bonding safeguards.
- Understanding Electrostatic Discharge Testing — Related testing concepts for materials and operations where static accumulation can create quality or ignition hazards.
- Electrostatic Hazard Training — Practical instruction on electrostatic generation, grounding and bonding, ignition risk, and controls.
- Hazardous Area Classification — Identification and documentation of areas where flammable gas, vapor, or combustible dust atmospheres may occur.
When to Bring in a Qualified Specialist
Specialist support is particularly valuable when the proposed grounding system is large or safety-critical; soil is strongly layered or laterally variable; long traverses are constrained; measurements appear influenced by buried metal or energized systems; seasonal freezing is significant; or the results will support GPR, touch-voltage, step-voltage, cathodic-protection, or forensic conclusions.

Related Blogs

Building a Combustible Dust Safety Program
Understand the conditions that lead to gas and vapor explosions, common industrial scenarios, and how facilities can reduce the risk.

ATEX vs IECEx Hazardous Area Classification
Understand the conditions that lead to gas and vapor explosions, common industrial scenarios, and how facilities can reduce the risk.
Protect Against Electrostatic Hazards
Understand the conditions that lead to gas and vapor explosions, common industrial scenarios, and how facilities can reduce the risk.
Soil Resistivity Information and Field Testing
Understand the conditions that lead to gas and vapor explosions, common industrial scenarios, and how facilities can reduce the risk.

SDS Creation and Physical Property Testing
Understand the conditions that lead to gas and vapor explosions, common industrial scenarios, and how facilities can reduce the risk.

UN/DOT HAZARDOUS MATERIALS TESTING
Understand the conditions that lead to gas and vapor explosions, common industrial scenarios, and how facilities can reduce the risk.

Thermal Stability Testing
Understand the conditions that lead to gas and vapor explosions, common industrial scenarios, and how facilities can reduce the risk.

Combustible Dust Hazard Identification and the Dust Hazard Analysis (DHA)
Understand the conditions that lead to gas and vapor explosions, common industrial scenarios, and how facilities can reduce the risk.

Chemical Reaction Hazard Testing & Reactive Chemical Services
Understand the conditions that lead to gas and vapor explosions, common industrial scenarios, and how facilities can reduce the risk.

ASTM Testing Services
Understand the conditions that lead to gas and vapor explosions, common industrial scenarios, and how facilities can reduce the risk.

Aerosol Testing Services: Flammability, UN/DOT Classification and Safe Handling
Understand the conditions that lead to gas and vapor explosions, common industrial scenarios, and how facilities can reduce the risk.

DHA vs. PHA: How Should You Choose for Your Facility?
Understand the conditions that lead to gas and vapor explosions, common industrial scenarios, and how facilities can reduce the risk.